Beware of Claims About Science & Algorithms & Solunar Fishing Scores
TL;DR
- Solunar scores and fishing algorithms can be useful summaries, but they are not proven science unless tested against real catch outcomes.
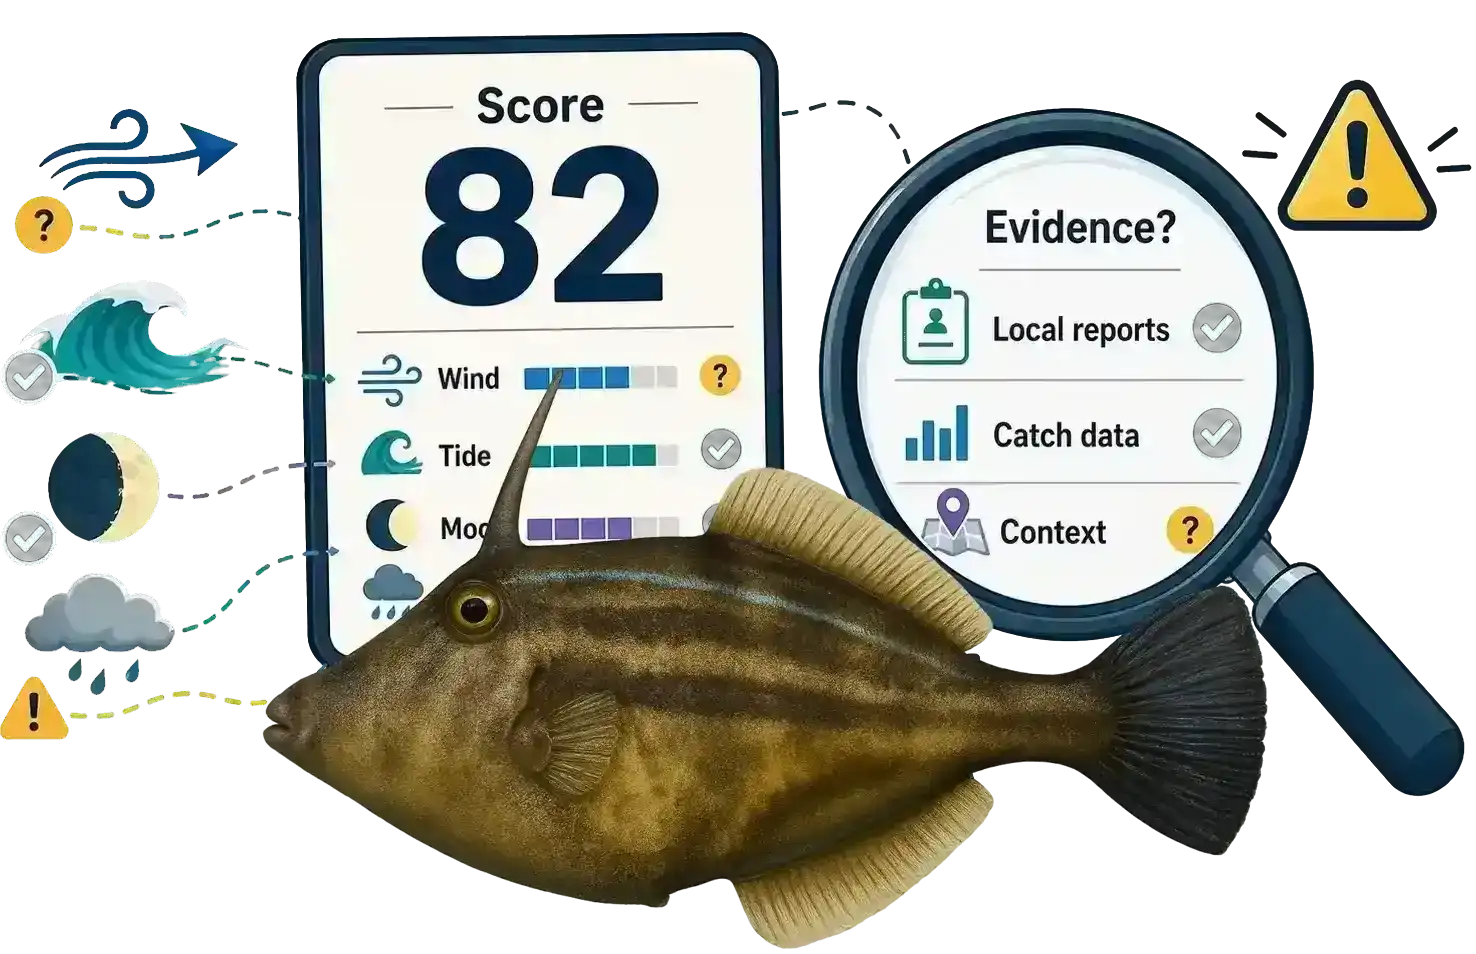
- Precise-looking scores like 75 or 82 can imply certainty that the underlying data may not support.
- Fishing results depend on many local factors, including species, structure, bait, water clarity, weather, access, and recent fishing pressure.
- Models can mislead by double-counting related inputs, using fixed clock times instead of real daylight, or ignoring time zones and daylight saving.
- Generic rules about wind, rain chance, tides, and moon phase do not work well between locations or hemispheres.
- Good forecasts should assist decision-making, showing context & recent local evidence, not command anglers to fish based on a single number.
Let’s Start With the Big One - “Science-Washing”
Most of us are used to trusting anything labelled as scientific, and we rarely stop to question it. A study in the Journal of Experimental Social Psychology found that " people who trust science are more likely to believe fake claims if those claims use scientific references." Study is here
It might seem odd to use a scientific study to question other scientific claims, but it makes sense here. This research is peer-reviewed 1, so it follows real scientific methods, not just marketing talk.
So when a fishing tool claims to use “Scientific”, “Science”, or “Algorithm” to back up its “forecast”, that’s not real science; it’s pseudoscience.
Ask yourself: Where is the evidence? What controls were used, if any? Was it actually peer reviewed, or just ‘pal reviewed’? Peer review means real scientists checked the data. ‘Pal review’ is just friends saying, “She’s great, mate!”
On Getfished, I have avoided doing this and said so whenever I can. It bothers me so much that I’ve placed explanations and links on every fishing forecast page. Sure, I use solunar when I fish; no, I can’t prove it works. At this point, there is no scientific evidence to support it and much to show it depends on a myriad of factors that can’t be predicted. It is, at best, anecdotal and has remained that way for almost one hundred years.
Why a Single Fishing Score Can Look More Certain Than It Is
A single fishing score can be appealing.
It’s easy to glance at a number like 75 labeled Great and feel like the decision is simple: the conditions look good, so you should go fishing.
There is nothing inherently wrong with summarising conditions. A score can be a useful way to bring together weather, tides, daylight and other inputs.
The problem starts when a score seems more reliable than the evidence actually supports.
A fishing forecast or app may show something like:
- Wind: 15/15
- Tide range: 15/15
- Moon phase: 13/20
- Overall score: 75 — Great!!
It looks precise, and sometimes even stars are added. But unless the formula has been tested with real fishing results, it’s just an opinion about the conditions—not an actual measurement of your chances of catching fish. Indeed, I looked at this at What 20,000 Fishing Reports Tell Us About Solunar and it wasn’t what I expected at all.
So you need to ask - where is the data to support “Great” in the forecast? On Getfished, you will see percentages. Those represent the solunar scoring according to the tables and formula used by John Alden Knight as outlined in his book “Moon Up Moon Down.”
It’s a pattern, it’s an algorithm, and it’s widely used, but it’s not proven science. Getfished uses these scores to answer questions like “What’s the solunar forecast for Melbourne today?” or for any other spot you might be interested in. It’s not a guarantee you’ll catch fish. It’s just saying, “Here’s what solunar theory suggests,” and you can choose to use it or ignore it.
This difference is important because fishing isn’t the same everywhere. What works in one place for one species with a certain technique might not work somewhere else or at a different time. There are so many changing factors that it’s nearly impossible to run a controlled experiment without getting odd results and contradictions. An Algorithm is Like Statistics; They Can Be Made To Say Anything
We’ve all heard the saying about “damn lies and statistics.” Algorithms are much the same. They’re just tools that use patterns to get a certain result, and statistics work similarly. Sure, both can involve impressive math. But fish are living creatures, and they’re affected by unpredictable things in their environment. We can’t really know where bait fish will gather except in very general terms. These “inputs” aren’t guaranteed and depend on past data, which can change for reasons the model doesn’t include.
Take pollution, for example. You might see a “Good or Excellent” rating, but if a blue-green algae outbreak wiped out the fish two weeks ago and you didn’t know, you probably won’t catch anything.
A score is a summary, not proof
A fishing score is often created by assigning points to inputs such as:
- wind speed;
- tide movement;
- tide range;
- moon phase;
- barometric pressure;
- rainfall chance;
- time of day;
- swell;
- water temperature.
The score may then add those values together and produce a label such as Poor, Fair, Good or Great.
A score can be helpful as a general summary. But it doesn’t prove fish will bite, or even that there are fish where you’re fishing. For example, if there’s no structure, many species will be somewhere else—even if that’s just 500 meters or several kilometres away.
For a number to become a meaningful prediction, it needs to be tested against actual catch outcomes over time. That means comparing the forecast conditions with what was actually caught, where and when it was caught, and how often similar conditions produced similar results.
Without that validation, exact-looking weights and multipliers are still choices. Without real testing, those precise-looking weights and multipliers are just choices made by whoever built the model. They might be opinions, but they’re not facts and they’re not scientific.. Because, using that method, you can claim the world is flat, the sun revolves around the earth, or that elves and pixies are real.
In programming, we call this “GIGO”, which stands for “Garbage in, Garbage Out."2
The false precision problem
There is a big difference between saying:
Light wind, a building tide and a dawn bite window may be worth considering.
and saying:
Conditions are 82 out of 100. Rating: “Good Fishing.”
The first statement makes room for uncertainty. It provides useful context without claiming that any particular combination of inputs guarantees a result.
The second statement can make it seem more precise than it really is. It’s puffery 3 at best and misleading at worst. It’s like when awn energy drink claimed it “…gave you wings!—nobody took that literally.**
A score of 82 rather than 78 suggests that the model has found a measurable difference between those situations. But that is only true if the numbers were derived from real-world testing and repeatedly shown to correlate with better fishing outcomes.
Otherwise, the difference between scores is just an arbitrary choice.
Indeed, the actual peer-reviewed studies that have been done on solunar have been inconclusive at a minimum 4.
Overlapping inputs can be counted twice
One of the easiest problems to create in a scoring system is double-counting.
Moon phase is a good example. In tidal waters, the moon can influence tidal range. New and full moons are often associated with larger spring tides, while quarter moons often produce smaller neap tides.
If a model says moon phase matters mainly because it affects tidal amplitude, then separately scoring:
- moon phase;
- tidal range;
- tide direction;
can give the same underlying effect more than one influence on the final result.
That doesn’t mean moon phase, tidal range, or tidal movement are useless. It just means the model should be clear about whether it’s measuring different effects or counting the same thing more than once. Otherwise, it can suggest a connection that isn’t really there.
The same issue can appear with weather factors. For example, pressure trend and proximity to a weather front may be closely related. If both are scored highly, the model should explain what distinct information each contributes.
Some species, like Australasian Snapper, often come closer to shore during storms to feed, so that you might catch bigger snapper than usual from a bayside pier. On the other hand, Garfish tend to disappear, and Calamari move into deeper water.
Clock time is not the same as daylight
A fixed rule such as:
Dawn: 4:00 am–8:00 am
Dusk: 5:00 pm–8:00 pm
It’s easy to program, but it’s not a reliable replacement for actual daylight conditions.
Sunrise, sunset, and twilight vary substantially throughout the year. What counts as dawn in summer is not the same as dawn in winter. The useful period may also change with:
- species;
- water clarity;
- habitat;
- cloud cover;
- depth;
- whether the angler is fishing an open beach, deep pier, shaded river bend or shallow flat.
A better approach is to show actual sunrise and sunset times, then present them alongside other relevant conditions, rather than assigning the same fixed clock bands to every day.
Time Zones and Daylight Saving
Time zones and daylight saving can really mess up websites and apps. Most people know the world is divided into time zones, with differences of an hour or more. Some places also observe daylight saving time, which makes things even trickier. I’m surprised how often people forget this when posting times for sunrise, moonrise, tides, and so on. These mistakes can add up over several days.
Finally - the track of the moon across hemispheres. It’s reasonable to say the moon’s phase is seen globally at the same times. The moon’s path is different in the northern and southern hemispheres. It doesn’t orbit the equator. The Earth is not a smooth, even sphere. Some of these factors modify moon times slightly and need to be taken into account.
Wind Direction and Fishing Rules of Thumb
These “rules of thumb” suffer badly in the Southern Hemisphere. In the Northern Hemisphere, a northerly frequently brings cool or even freezing conditions. In Australia, for example, it’s the opposite. So who is right when the saying goes, “Wind from the North, do not go forth,” when some of the best fishing in Victoria can be had during the summer, with northerly winds are prevalent during those months?
The saying “Wind from the East, Fishing is Least” is too general. It doesn’t consider sheltered spots that are protected from the wind, just like many of these other “rules” it overlooks location specfici and important details.
What matters more is the location you are fishing in vs the prevailing wind. Can you fish it in comfort? Are the fish present? Are they feeding?
Rain chance is not rainfall intensity
Rain probability is often easy to obtain from weather APIs, but it should not be confused with how much rain may actually fall.
An 80% chance of a few drops is not the same thing as heavy rain.
Likewise, a 30% chance of a severe thunderstorm can matter more to safety and comfort than a higher chance of drizzle.
How much rain falls, the risk of storms, wind, lightning, river flows, and local access all matter. A simple rain-chance score might be handy, but it can hide the difference between just a wet afternoon and truly dangerous weather.
Local assumptions do not travel well
A model calibrated around one estuary system may be useful there. It should not be treated as universal automatically.
A tidal range that suits a sheltered Sydney estuary may not suit:
- Port Phillip;
- Western Port;
- Victorian surf beaches;
- freshwater rivers;
- impoundments;
- alpine streams;
- Murray Cod water;
- a jetty in deep water;
- an estuary entrance with different flow and structure.
The same applies to wind.
A gentle onshore breeze may improve a surf beach by stirring water and moving bait. That same breeze can make a kayak trip uncomfortable or unsafe. A stronger wind may help cover an angler’s presence in one protected estuary but make casting impossible from an exposed pier.
There is no universal wind score that accounts for all those situations.
Important factors are often missing
Most fishing-condition models are built around fields that are easy to collect from public weather, tide and moon data.
But some of the most important influences are often harder to measure consistently:
- water clarity and turbidity;
- freshwater flow and river height;
- bait presence;
- water temperature at depth;
- local structure;
- access conditions;
- seasonal closures;
- crowding;
- recent fishing pressure;
- location-specific safety issues.
A score might look complete but still omit important factors specific to your fishing spot.
This isn’t an argument against using forecast data. It’s just a reminder not to treat a single number as the whole answer.
What a more useful fishing forecast looks like
Fishing forecasts are most useful when they help anglers make their own informed decision.
That means showing the underlying context:
- current weather and wind;
- tides and tide movement where relevant;
- solunar activity and bite windows;
- actual sunrise and sunset;
- pressure and rainfall context;
- species guidance;
- bait or lure context;
- recent fishing report patterns;
- historical report patterns;
- access, safety and location notes.
A rising tide might help at one spot but not matter at another. A rough day could be great for one species but bad for another. Even a calm, sunny day with a high score might not produce much if there’s no bait, the water is dirty, or the fish are somewhere else.
Recent reports do not guarantee a catch either. But they provide something a generic score cannot: evidence that anglers have actually been catching particular species in comparable places.
Forecasts should assist, not command
The honest role of a fishing forecast is not to say:
The score is 82. Go now.
It is to say:
These are the conditions. These are the likely opportunities and limitations. Here is what recent local evidence suggests. Use that information to decide whether the trip is worthwhile.
Fishing remains uncertain. That is part of the appeal.
The best fishing advice doesn’t try to erase uncertainty with a flashy number or a bold label. Instead, it helps you understand the conditions, compare them with local reports, and make better choices about where, when, and what to fish for.
Final Word
The main reason people get disappointed when fishing isn’t the moon, the tide, or the weather. It’s not knowing which species to target, when to go after them, or the best ways to catch them. Even fishing celebrities and YouTubers have days when they catch nothing. The difference is, they’ve built up enough skills to have fewer of those days—by choosing the right tackle, using bait or lures they trust, and learning which spots and conditions work best.
Personally, I’ve caught fish many times at a pier right after others said there was “nothing there today.” It’s all about adjusting things like berley, bait, and hook size through trial and error. Anyone can do this—it just takes time and practice.
Share this post

Written by
Scott Kane
Founder, Getfished
Scott's a software developer and the founder of Getfished. He's a long-time recreational angler focused on practical fishing forecasts, fishing report data, and decision-support tools for Victorian anglers.
He has a background in complex software systems and data analysis. Scott has a penchant for building software using low level tools, developing products like Getfished in C, Pascal, SQLITE and Hugo.